
Example usage code
To help you get started, here are a few minimalist .NET C# projects that you can review. They are complete working examples.
ConsoleAppis a minimalist example of how to use the library (start here)Backtestis a slightly more complicated example of how to analyze resultsCustomIndicatorsLibraryshows how you can create your own custom indicatorsCustomIndicatorsUsageshows how you'd use custom indicators just like any other in the main libraryUseQuoteApishows how you'd get quotes from an API quote source, using the Alpaca SDK for .NETLiveSignalsis a live market desk: real crypto or US stock feeds, daily regimes and rotation across a basket, explained one-minute signals, and narrated insights in a browser or headless console (no key needed for crypto)
For more information on how to use this library overall, see the Guide.
Getting started with our sample projects
LiveSignals streams crypto from Kraken's public feed by default, with no key. Its US stock mode and the UseQuoteApi example use Alpaca market data instead; to run those, get a free Alpaca API key and secret, then set your local environment variables.
Run the following command line items to set, after replacing the MY-ALPACA-KEY and MY-ALPACA-SECRET values; then restart your IDE.
bash
# use your own keys
setx ALPACA_KEY "MY-ALPACA-KEY"
setx ALPACA_SECRET "MY-ALPACA-SECRET"
Get and run the sample projects
- Download the ZIP file and extract contents
- Open
Examples.slnin Visual Studio - Review the code in the
Program.csfile(s) - Run the
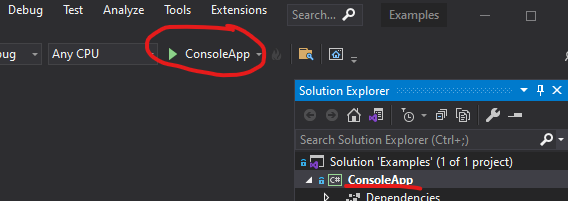
ConsoleAppor any other project with one of the following methods:select (will be bold in Solution Explorer) and press the
CTRL+F5keyexecute
dotnet runCLI command in theConsoleAppproject folderclicking the play button
Backtest example
/* This is a basic 20-year backtest-style analysis of
 * Stochastic RSI.  It will buy-to-open (BTO) one share
 * when the Stoch RSI (%K) is below 20 and crosses over the
 * Signal (%D). The reverse Sell-to-Close (STC) and
 * Sell-To-Open (STO) occurs when the Stoch RSI is above 80 and
 * crosses below the Signal.
 *
 * As a result, there will always be one open LONG or SHORT
 * position that is opened and closed at signal crossover
 * points in the overbought and oversold regions of the indicator.
 */

// fetch historical price bars from data provider
IReadOnlyList<Bar> bars = GetBarsFromFeed();

// calculate Stochastic RSI
IReadOnlyList<StochRsiResult> resultsList =
  bars.ToStochRsi(14, 14, 3, 1);

// initialize
decimal trdPrice = 0;
decimal trdQty = 0;
decimal rlzGain = 0;

Console.WriteLine("   Date   Close  StRSI Signal  Cross  Net Gains");
Console.WriteLine("-------------------------------------------------------");

// roll through source values
for (int i = 1; i < bars.Count; i++)
{
  Bar q = bars[i];
  StochRsiResult e = resultsList[i];   // evaluation period
  StochRsiResult l = resultsList[i - 1]; // last (prior) period
  string cross = string.Empty;

  // unrealized gain on open trade
  decimal trdGain = trdQty * (q.Close - trdPrice);

  // check for LONG event
  // condition: Stoch RSI was <= 20 and Stoch RSI crosses over Signal
  if (l.StochRsi <= 20
   && l.StochRsi < l.Signal
   && e.StochRsi >= e.Signal
   && trdQty != 1)
  {
    // emulates BTC + BTO
    rlzGain += trdGain;
    trdQty = 1;
    trdPrice = q.Close;
    cross = "LONG";
  }

  // check for SHORT event
  // condition: Stoch RSI was >= 80 and Stoch RSI crosses under Signal
  if (l.StochRsi >= 80
   && l.StochRsi > l.Signal
   && e.StochRsi <= e.Signal
   && trdQty != -1)
  {
    // emulates STC + STO
    rlzGain += trdGain;
    trdQty = -1;
    trdPrice = q.Close;
    cross = "SHORT";
  }

  if (cross != string.Empty)
  {
    Console.WriteLine(
    $"{q.Timestamp,10:yyyy-MM-dd} " +
    $"{q.Close,10:c2}" +
    $"{e.StochRsi,7:N1}" +
    $"{e.Signal,7:N1}" +
    $"{cross,7}" +
    $"{rlzGain + trdGain,13:c2}");
  }
}
Console output
console
   Date         Close  StRSI Signal  Cross    Net Gains
-------------------------------------------------------
1999-11-01  $1,354.12   92.0   97.3  SHORT        $0.00
1999-12-01  $1,397.72   14.6    4.9   LONG     ($87.20)
1999-12-28  $1,457.66   96.9   97.6  SHORT       $76.28
2000-01-06  $1,403.45    5.2    2.9   LONG      $124.76
2000-02-09  $1,411.71   63.4   80.3  SHORT       $87.07
2000-02-22  $1,352.17    9.3    6.0   LONG      $197.89
2000-03-06  $1,391.28   77.8   92.6  SHORT      $216.57
2000-04-06  $1,501.34   22.0    7.3   LONG     ($42.66)
2000-05-17  $1,447.80   77.6   92.5  SHORT     ($39.68)
2000-05-24  $1,399.05   33.8   19.8   LONG      $111.36
2000-06-05  $1,467.63   89.9   96.1  SHORT      $199.77
2000-06-26  $1,455.31   29.8    9.9   LONG      $155.83
2000-07-14  $1,509.98  100.0  100.0  SHORT      $252.85
2000-07-25  $1,474.47   18.9   14.3   LONG      $269.20
2000-08-09  $1,472.87   82.5   90.9  SHORT      $230.49
2000-09-07  $1,502.51   29.4   18.2   LONG      $172.81
2000-10-23  $1,395.78   99.0   99.7  SHORT     ($11.01)
2000-11-14  $1,382.95   45.2   15.1   LONG      $121.38
2000-12-12  $1,371.18   89.0   94.1  SHORT       $85.01
2000-12-18  $1,322.74   34.5   34.4   LONG      $193.66
2001-01-05  $1,298.35   58.2   81.8  SHORT       $96.44
2001-02-09  $1,314.76    0.0    0.0   LONG       $88.01
2001-03-09  $1,233.42   46.1   74.1  SHORT     ($58.26)
2001-03-13  $1,197.66   36.0   27.4   LONG       $94.60
2001-03-28  $1,153.29   72.7   79.1  SHORT     ($29.90)
2001-05-15  $1,249.44   12.0   10.9   LONG    ($177.83)
2001-05-18  $1,291.96  100.0  100.0  SHORT        $3.36
2001-05-31  $1,255.82   10.4    3.5   LONG       $33.12
2001-07-05  $1,219.24   57.2   83.8  SHORT     ($76.18)
2001-07-12  $1,208.14   71.5   23.8   LONG     ($17.40)
2001-07-16  $1,202.45   62.9   74.1  SHORT     ($39.88)
2001-07-25  $1,190.49   63.7   42.5   LONG     ($10.27)
2001-08-02  $1,220.75  100.0  100.0  SHORT       $38.29
2001-08-16  $1,181.66   13.5    9.3   LONG       $86.21
2001-08-28  $1,161.51   42.8   75.9  SHORT        $6.82
2001-08-31  $1,133.58   12.8    9.8   LONG       $82.83
[...]
2020-01-08  $3,253.05   22.8   13.4   LONG      $633.19
2020-01-21  $3,320.79   70.1   81.6  SHORT      $797.71
2020-01-28  $3,276.24   24.6    8.2   LONG      $819.07
2020-02-18  $3,370.29   86.4   92.8  SHORT      $962.62
2020-02-26  $3,116.39    0.0    0.0   LONG    $1,376.37
2020-03-27  $2,541.47   87.3   95.8  SHORT     ($27.37)
2020-05-14  $2,852.50   23.5   11.3   LONG     ($74.51)
2020-05-21  $2,948.51   78.6   83.2  SHORT      $428.54
2020-06-15  $3,066.59   19.7   10.6   LONG       $96.37
2020-07-07  $3,145.32   73.8   86.8  SHORT      $371.91
2020-07-27  $3,239.41   32.7   25.2   LONG      $105.00
2020-08-07  $3,351.28  100.0  100.0  SHORT      $422.83
More info
- Tutorial: Create a simple C# console app
- These files can also be found in the /docs/examples GitHub repo folder